:quality(80)/cloudfront-us-east-1.images.arcpublishing.com/morningstar/6ZMXY4RCRNEADPDWYQVTTWALWM.jpg)
Too Big, Too Fast
In 1998, Nasdaq-100′s overseers faced a problem. Microsoft MSFT made up more than one fourth of the portfolio’s assets. Since 25% was the legal limit that a mutual fund or exchange-traded fund could invest in a single security, funds that tracked the Nasdaq-100 could not do so precisely. Consequently, the index team ordered that Microsoft’s weight be slashed through a “special rebalancing.”
Thirteen years later, Apple AAPL became the next headache, as it accounted for 20% of the portfolio. What’s more, although its market cap was only moderately larger than Microsoft’s, it accounted for 5 times the portfolio’s assets (thanks to the effect of 1998′s fix). The situation was awkward. If Microsoft outgained Apple, the Nasdaq-100 benchmark would be strongly criticized. So the index team mandated another rebalancing: Apple’s position would be decreased to 12%.
Fast forward to this month. On Monday, the Nasdaq-100 will undergo its third rebalancing. This time, the culprit is not one company, but instead a group known as the Magnificent 7. Collectively, those stocks (Apple, Microsoft, Alphabet GOOGL, Amazon.com AMZN, Nvidia NVDA, Tesla TSLA, and Meta Platforms META) now make up more than half the benchmark’s portfolio, once again threatening funds’ abilities to replicate it.
What Is an Index?
As you may have noticed, I have refrained from calling Nasdaq-100 an “index”—although its sponsors label it as such. Jack Bogle would have firmly disagreed with that assessment, and so do I. By my reckoning, which is somewhat more liberal than Bogle’s, there are four tiers of indexing.
- Traditional: Traditional indexes invest broadly, according to each security’s capitalization. Such benchmarks are unquestionably passive. The Wilshire 5000 Index is an example.
- Equal Weight: Equal-weight indexes also mimic a broad marketplace but place the same amount of assets into each holding. This approach is both passive and active. It is passive because it invests solely through a simple mechanical rule, but active in that it ignores investors’ collective judgment. The S&P 500 Equal Weight Index is an example.
- Focused: Focused indexes invest narrowly. Rather than clone an entire marketplace, they replicate one of its segments. They, too, are neither fully passive nor active, in that they invest through a simple mechanical rule but add an active component with their segment selection. They may weight either by market cap or equally, with the latter pushing them further toward active. The Russell 1000 Value Index is an example.
- Strategic Beta: Technically, Morningstar also calls focused indexes “strategic beta.” But the purest application of that term consists of indexes that are created by combining several rules in an attempt to create a better investment. The rules may be applied consistently, but the mindset is active—and the portfolio should be deemed as such. The Morningstar Dividend Leaders Index is an example.
The Index Hierarchy
|
Type |
Strategy |
Weight |
Representation |
Example |
|---|---|---|---|---|
| Traditional | Passive | Market Cap | Broad | Wilshire 5000 Index |
| Equal Weight | Mixed | Equal | Broad | S&P 500 Equal Weight Index |
| Focused | Mixed | Market Cap | Narrow | Russell 1000 Value Index |
| Strategic Beta | Active | Consistent Rules | Narrow | Morningstar Dividend Leaders Index |
There is no room on that list for the Nasdaq-100. If it invested by capitalization, it would be a quirky version of a focused index (quirky in that it restricts its universe not through investment factors but according to a stock’s listed exchange). However, as the benchmark is sometimes modified merely for customer convenience, it lacks the consistency required for an index.
1 for 2
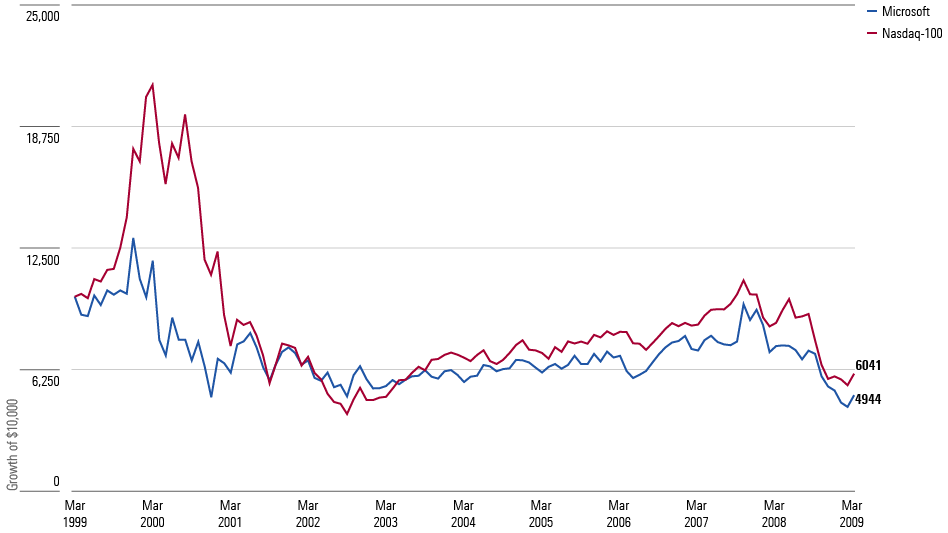
How, one might wonder, have the Nasdaq-100′s adjustments affected its future returns? The first action, in 1998, was to cut its Microsoft position. Over the next decade, that decision benefited the benchmark. (Well, almost the next decade, as my data source begins in April 1999.) It lost 40%, but Microsoft fared worse yet, losing 51%. A rough stretch, to be sure, but nonetheless the rebalance was helpful.
A Winning Decision
(Growth of $10,000, April 1999 - March 2009)
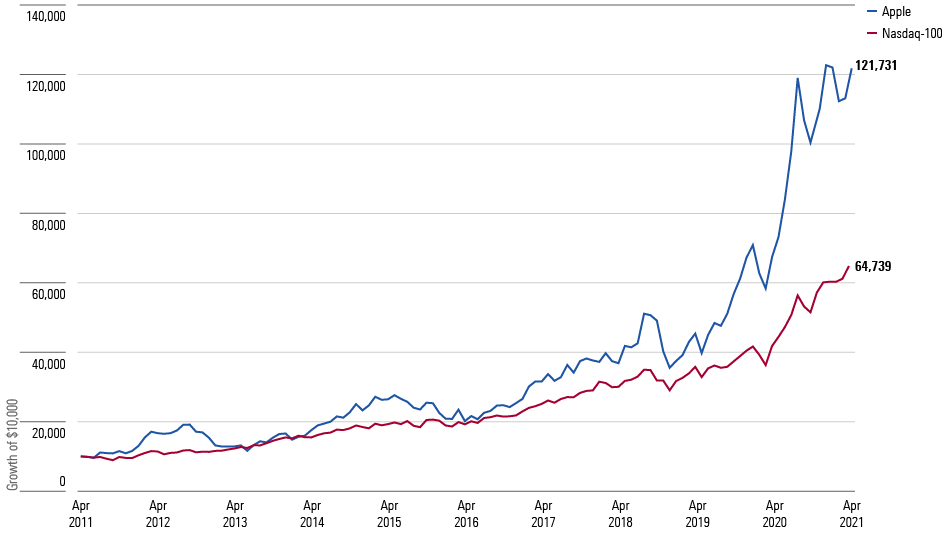
Not so the Apple reduction. When Apple reached 20% of the Nasdaq-100′s total in 2021, it was not because its shareholders had grown manic. Quite the contrary. It was because they realized that as successful as the company had already been, its brightest days lie ahead. Thanks to ever-stronger business results, Apple’s stock grew 11-fold during the next decade, dwarfing the benchmark’s total.
Then a Losing One
(Growth of $10,000, May 2011 - April 2021)
Apple’s outcome demonstrates that while it can be comforting to assume that curtailing a benchmark’s top performers will improve returns, as hot stocks eventually revert to the mean, the expected behavior will not necessarily occur. Sometimes, leading stocks fully deserve their position—particularly within the technology sector, which (in)famously rewards scale. The rich often get richer.
At the Right Price
Ultimately, investors value tangible results more than opportunity costs. The relevant question for them is whether the Nasdaq-100 has beaten its true investment rivals: large-growth stock funds. The chart below shows how it would have ranked against actively run large-growth funds, expressed in percentile terms, from April 1999 through June 2023. The first set of bars assumes the benchmark could be held at no cost, while the second set debits the Nasdaq-100 with the large-growth Morningstar Category’s average annual expense ratio, which was 0.99% during the period.
Nasdaq-100 Percentile Rankings
(Versus Large Growth Funds, April 1999 - June 2023)
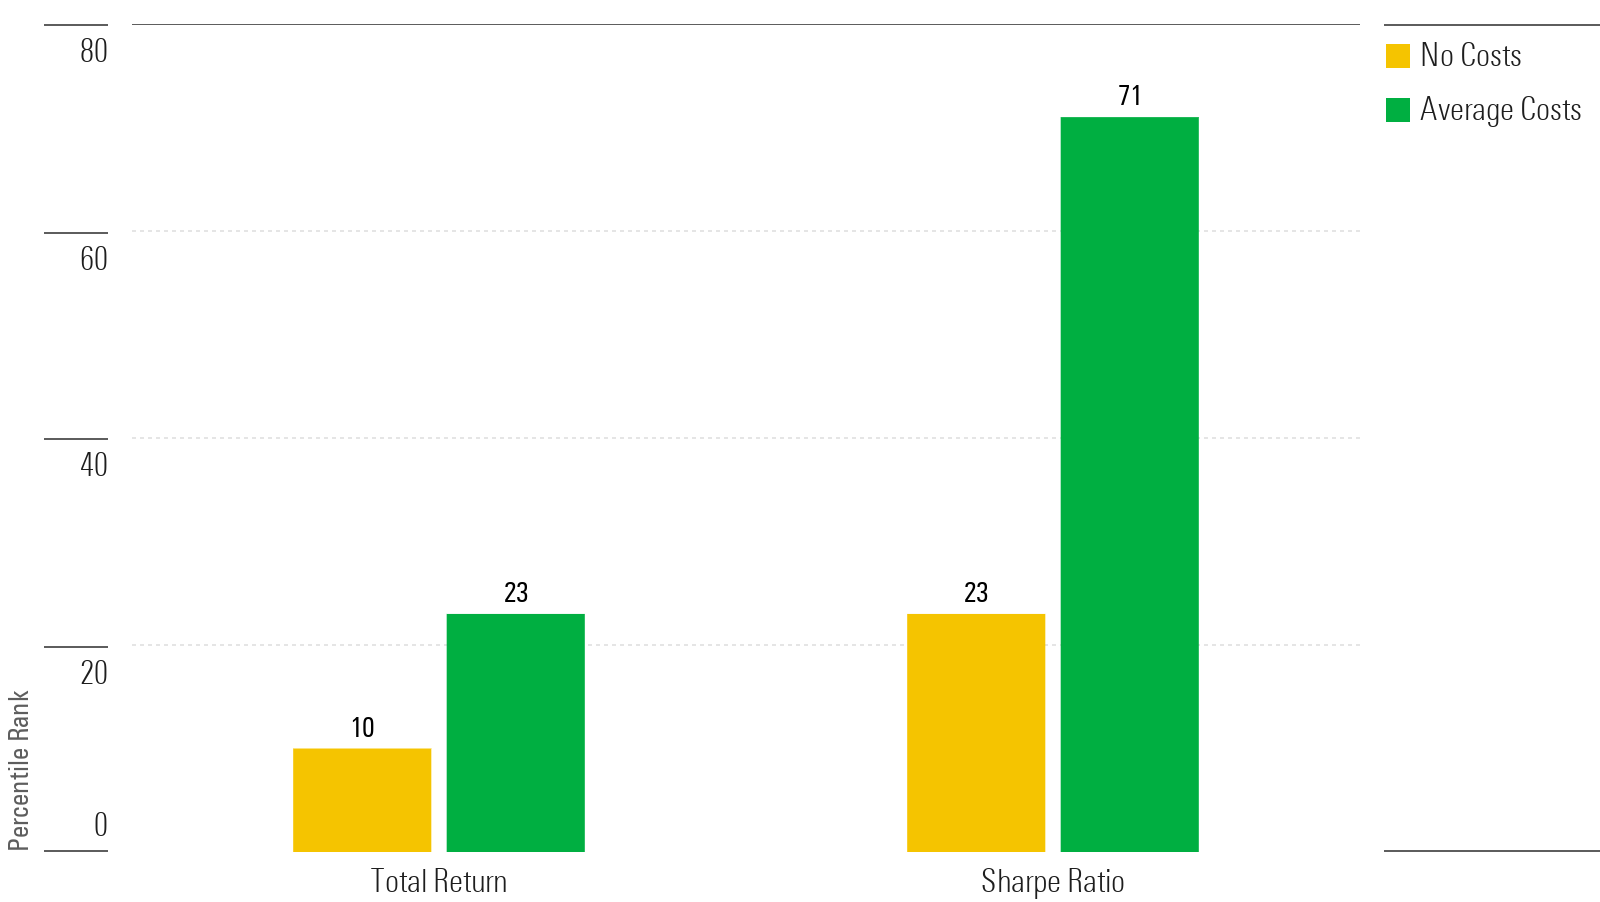
Smaller bars are better, as Morningstar percentiles are assigned so that 1 is the best outcome (highest return, or lowest risk). Thus, the Nasdaq-100 has been a strong relative performer before expenses. Not so if it had carried average costs, though. Had that been the case—as indeed it has been, for some of the pricier Nasdaq-100 funds—its returns would have beaten the norm, but not its risk-adjusted Sharpe ratio.
Conclusion
Bogle would have scoffed at the Nasdaq-100 being an “index.” However, its performance illustrates one of his core beliefs: that the critical element of low-cost indexing is the first term, not the second. It is a faulty benchmark, but if it can be acquired on the cheap, it will likely outdo its investment rivals over the next 25 years, as it has done over the past quarter century.
Low-Cost Nasdaq-100 Funds
|
Fund |
Expense Ratio (%) |
|---|---|
| Invesco Nasdaq 100 ETF QQQM | 0.15 |
| Invesco QQQ Trust QQQ | 0.20 |
| Victory Nasdaq-100 USNQX | 0.42 |
| VALIC Company I Nasdaq-100 Index VCNIX | 0.45 |
The views expressed here are the author’s.


:quality(80)/cloudfront-us-east-1.images.arcpublishing.com/morningstar/5FNGF7SFGFDQVFDUMZJPITL2LM.png)
:quality(80)/cloudfront-us-east-1.images.arcpublishing.com/morningstar/EOGIPTUNFNBS3HYL7IIABFUB5Q.png)