For Comparison's Sake
Dumb mutual fund investors were once the media rage. Hand-wringing articles carped that their collectively poor decisions would hurt other market participants, because newbie 401(k) shareholders would panic when the next downturn arrived. Their mass redemptions would spark further stock-price declines.
Now that financial writers' attention has switched to indexing, the articles have abated. Nonetheless, the perception remains: Retail shareholders are markedly less successful than their institutional rivals. That's a difficult proposition to test, because while many institutional funds publish their investment results, individuals do not. However, if we can't score the outcomes, we can at least assess the processes, by evaluating each group's aggregate asset allocations.
My sources are Morningstar Direct, which contains the allocations for mutual funds and exchange-traded funds, and the data compiled on state and local pension plans by National Association of State Retirement Administrators. To be sure, there are many forms of institutional investing besides state and local pensions, but NASRA's database should serve as a useful proxy.
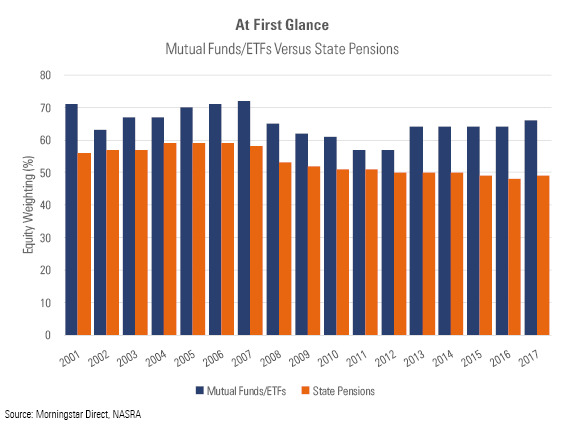
The bar graph below displays the average equity weightings for the two groups from 2001 through 2017. The mutual fund/ETF figure includes all monies held by diversified U.S. equity, international equity, and specialty equity funds, divided by the total amount of long-term fund assets. The pension-fund percentages come from NASRA's latest report; they show the equity-weighted averages of 90-plus plans.
Rebalancing (Or Not)
Retail investors have long held more equities than the pensions, and their lead is growing. That is surprising given the difference between the two parties' time horizons. Unless it is scheduled to be terminated, a pension plan will exist indefinitely, while fund investors most certainly will not. However, there is some logic for the pattern, as pensions face ongoing withdrawals, whereas until retirement, retail investors do not touch their tax-sheltered accounts.
A second difference is that pensions rebalance routinely, while fund investors do not. The average pension equity weighting rose from 2001 through 2002, even as stocks were declining, thereby indicating the pensions were aggressive net buyers during the period. Pension-fund managers also bought stocks during 2008, as their aggregate equity position dropped by one tenth (to 53% from 58%), while the global stock markets fell more than 35%.
In contrast, retail investors freeze when the bear arrives. They don't buy when stocks become cheaper. Rather, they wait for the markets to recover. They rode their equity weighting down in 2002, rode it back up again during the next half decade, and then rode it down again during the financial crisis.
At that point, suggests the chart, fund investors actively avoided equities. From year-end 2008 through 2012, the average fund equity weighting dropped by 8 percentage points, although the S&P 500 gained handsomely during the period. Such behavior is the opposite of rebalancing--it is unbalancing. Selling an already low position even as stocks are rising is akin to overturning the investment boat.
In short, the chart's evidence isn't particularly favorable for retail investors. Their appetite for stocks can be excused, but not their refusal to rebalance, nor their four-year fear following 2008. They lacked pension-fund managers' discipline.
Rethinking the Calculations
This story, however, remains to be finished. The chart was accurate in its way, but incomplete. It excludes investments--such as balanced funds--that carry stock-market exposure but are not officially labeled as equities. In addition, while NASRA's pension-fund allocations account for cash, Morningstar's retail-fund figures do not. To improve the comparison, they should include money market assets.
It's easy enough to add the money markets but not so simple to determine those supplemental stock-market exposures. For that task, I settled on 50/50 split. The two investment types in question, allocation funds and alternatives, were treated as consisting 50% of equities.
That estimate is verifiably near the truth for allocation funds, which are almost exclusively mutual funds, and thus have public records. Whether the assumption holds for alternatives is harder to say, because they are primarily owned by pensions, and therefore their details are hidden, but the figure can't be far from the mark. After all, venture-capital, private-equity, and leveraged-buyout funds are each equity investments and are each classified by pensions as "alternatives."
Let's Try That Again
The adjustments made a big difference.
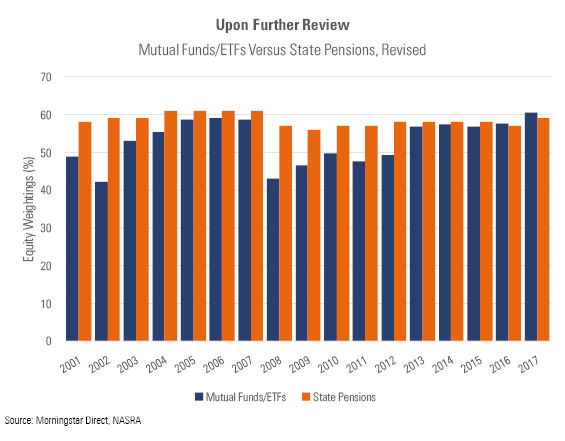
The biggest change: Pension managers--not retail investors--held more stocks through the time period. When money market assets are considered, retail funds have consistently posted lower equity allocations than their institutional cousins, until the two groups converged earlier this decade. Indeed, one could argue that until recently, mutual fund/ETF investors were overly conservative, as their overall equity weighting frequently placed below 50%.
The revised chart depicts pension-fund managers as even more disciplined than before. Although the first illustration indicated that they rebalance reliably, it also suggested that they have gradually cut their stock positions over time. In fact, they did not. Yes, pension funds reduced their direct equity (or equity-fund) holdings, but they simultaneously replaced many of their bonds with equity-bearing alternatives. The two moves pretty much canceled each other out.
Retail investors also fare somewhat better after the modifications. Their behavior after the 2000-02 bear market appears the same with both charts, but their reaction to 2008 improves with the second look. Previously, it seemed that fund investors unloaded stocks during the first few years of the ensuing bear market. In truth, they pretty much stayed put. It turns out that while retail investors don't often rebalance, they don't often panic, either.
The two groups' equity allocations are now in virtual lock step, with retail funds at last report registering 60% and pension funds at 59%. (Whatever the investment question, the answer always seems to be "60/40.") What distinguishes the parties, beside their rebalancing policies, is the remaining 40%. Retail funds hold cash and investment-grade bonds, while pension funds are more aggressive.
Whether pension funds' additional complexity will avail them remains to be seen. For their part, retail investors have surely made the correct call. The professionals may embrace complexity, if they wish. The rest of us are advised to keep things simple, by offsetting risky equities with safe cash/bonds. That's playing dumb, but being smart.
John Rekenthaler has been researching the fund industry since 1988. He is now a columnist for Morningstar.com and a member of Morningstar's investment research department. John is quick to point out that while Morningstar typically agrees with the views of the Rekenthaler Report, his views are his own.


:quality(80)/cloudfront-us-east-1.images.arcpublishing.com/morningstar/5FNGF7SFGFDQVFDUMZJPITL2LM.png)
:quality(80)/cloudfront-us-east-1.images.arcpublishing.com/morningstar/EOGIPTUNFNBS3HYL7IIABFUB5Q.png)