Earlier this year, our team put Dunn’s Law to the test to determine whether stylistic differences between active and passive managers could help explain the variation of U.S. active fund managers’ success rates from Morningstar’s Active/Passive Barometer. Dunn’s Law predicts an inverse relationship between active managers’ index-relative performance and the performance of their investment style. That’s because active managers tend to be less style-pure than the indexes against which they are benchmarked. So, they should benefit when adjacent categories do better than their own and do worse when their Morningstar Category enjoys strong relative performance.
In this article, I test how well predictions from Dunn’s Law stack up when using asset-weighted return differences between active and passive funds to measure manager success rather than success rates. Success rates represent the percentage of funds in a Morningstar category that survive and outperform the equally weighted average passive fund return over a specified period. In this case, success is a binary measure, and gives all funds equal weighting, regardless of assets under management.
How to Measure Success?
The benefit of using success rate as the measure of success is that it accurately reflects investors’ odds of choosing a winning fund from the starting universe. All funds available at the start of the measurement period are given equal footing, and funds that are liquidated during the measurement period count as unsuccessful to account for survivorship bias. That is, it represents all funds available to an investor when they make their decision and penalizes those that close during the measurement period because that tends to be associated with poor performance and a bad investor experience. The drawback of this measure is that it doesn’t capture the magnitude of out- or underperformance. A fund earns a successful classification whether it outperforms the equally weighted index funds in its category by 0.1% or 10%.
In this article, I’ll use the asset-weighted return difference between actively managed funds and index-tracking funds as the dependent variable in the regression to test Dunn’s Law. Asset-weighted returns capture the magnitude of under- or outperformance and weight these returns by assets invested, so this metric likely better represents how the average investor dollar fared during the measurement period. If a fund with a lot of assets posts returns that trounce its asset-weighted index benchmark, then more investor dollars did well compared with the asset-weighted index dollar. But using asset-weighted returns doesn’t jibe with an event study methodology. Asset-weighted average returns include funds that existed in each month, but not funds that survive the full measurement period.
Another interesting wrinkle is that asset-weighted returns are usually higher than equal-weighted returns for both actively managed and index-tracking funds. This is likely because investors have chosen better and cheaper funds and allocated more dollars to them. Although both metrics seek to quantify how successful active managers have been, their relationship is not as strong as I had expected it to be. Exhibit 1 below shows a scatterplot of the quarterly rolling five-year success rates and asset-weighted return differences for the nine U.S. equity Morningstar Style Box categories from September 2002 through December 2017.
Exhibit 1: Five-year Success Rates vs Asset-weighted Return Differences
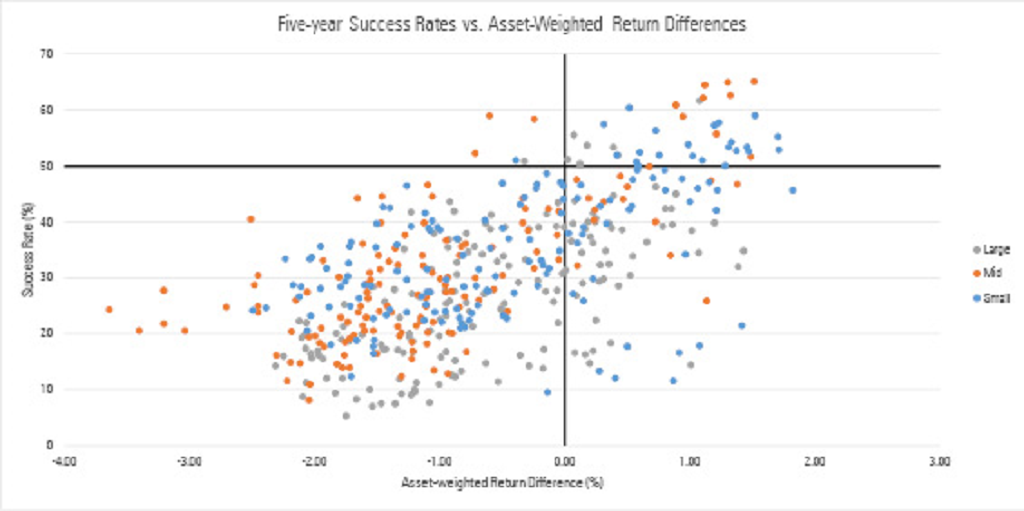
Source: Analysts' calculations; Morningstar Active/Passive Barometer; Morningstar Direct. Quarterly data (where available) from September 2002 through December 2017
The correlation between both measures is only about 0.6. It seems that achieving positive asset-weighted returns is more common than posting a success rate of greater than 50% in a Morningstar Category. There are 478 observations in Exhibit 1. Of those, 41 observations (8.6% of all observations) represent success rates greater than 50%, and 132 observations (27.6%) achieved positive asset-weighted return differences. Only 36 observations (7.5%) achieved both greater than 50% success rates and positive asset-weighted return differences.
In part 2 of this article, we will further look into our findings.


:quality(80)/cloudfront-us-east-1.images.arcpublishing.com/morningstar/5FNGF7SFGFDQVFDUMZJPITL2LM.png)
:quality(80)/cloudfront-us-east-1.images.arcpublishing.com/morningstar/EOGIPTUNFNBS3HYL7IIABFUB5Q.png)