The month-to-month inflation rate was just 0.1% (1.2% annualized) while year-over-year inflation was 1.7%. Both numbers were below expectations of 0.2% and 1.8%, respectively. Inflation has now been below expectations for six months in a row, suggesting issues in the Fed's efforts to raise inflation rates closer to 2%.
The inflation report again undershot expectations with month-to-month total inflation up only 0.1% versus expectations of 0.2%, which annualized to a mere 1.2%. The annualized month-to-month inflation rate has been under the Fed's 2% target for five consecutive months. There have been a lot of odd quirks that have pressured inflation rates in the monthly data since March--to be discussed later--but it seems that all of these quirks wouldn't keep popping up each month if inflation were really marching toward the 2% target. That said, based on what we already know about gasoline prices and what we surmise will happen with food and a couple of other categories, we suspect that inflation in August and September could be up in the 0.3% or 3.6% range. So I am not panicked about deflation, at least not yet. The inflation picture looks less volatile, but is still running at about two thirds of target if we exclude food and energy.
We spent months worrying about the fading impact of falling gasoline prices on headline inflation (the rate that customers actually experience), eventually raising it to look like the core rate of about 2%. Indeed, headline inflation shot past core inflation rates in February and March, potentially explaining some of the soft retail sales numbers of this spring. Now core and headline inflation have dropped back to 1.7%. That's good news for workers, who now see their raises going further (graph below).
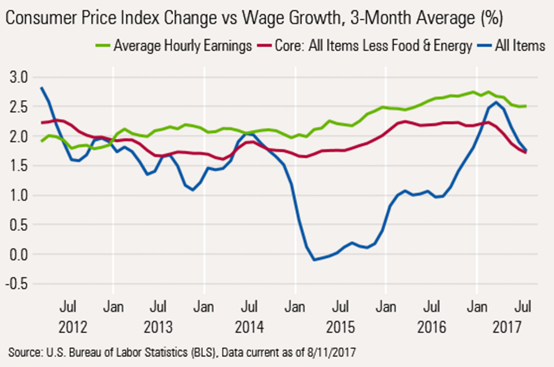
While inflation rates outside of gasoline have been extremely stable, gasoline has added a lot of volatility to even the year-over-year averaged data. The year-over-year inflation rate excluding gasoline was mostly in the 1.7%-2.0% range over the past year, before dipping to 1.6% for the most recent three-month period.
However, we suspect that year-over-year inflation will pick up again. Gasoline prices are up a bunch year over year, at least through April, and could remain elevated at least through mid-September, boosting the gasoline component significantly. We have enough data to be relatively sure about gasoline inflation in August and to make a decent guess at September. After that, we assume that prices revert to their seasonally adjusted 12-month average. We are assuming the central tendency of other inflation is about 1.9%. Food and cellphone service pricing have temporarily deflated the number a bit. With food prices on the rise again this month and the cellphone impact eventually burning off, our best inflation guess appears below:
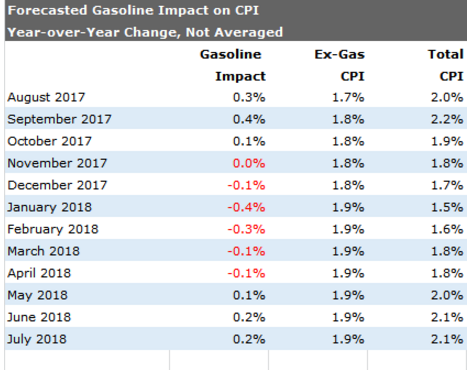
Source: Morningstar forecast
So without any more quirks, inflation could hit the Fed's 2% target in October, on a single-month basis. However, given the mechanics of gasoline pricing, inflation could dip back to 1.5% by January and then increase back to 2% or so. Of course, the caveat is that this forecast assumes relatively stable gasoline prices and no more quirks.
Most economists, including us, had assumed that inflation would be quite a bit higher by now, perhaps up in the 2.5%-3% range instead of 1.6% rate we saw in July. We currently aren't even expecting that headline inflation to get back over 2% until May. All of this began innocently enough. First, a bumper crop and large grain price declines since 2014 finally rolled through the entire food supply, starting with grains and chicken and ending with outright declines in beef prices in 2016. That helped year-over-year food fall for six consecutive months ended in February. Although prices are on the rise again, they really anchored the inflation rate for many months. While food inflation rates are incredibly volatile, over long periods of time food prices look quite similar to core inflation rates.
Potentially keeping inflation low are demographic factors. An aging population tends to buy fewer things and less food, potentially keeping a lid on the demand side for goods. However, services inflation, especially healthcare, could pressure inflation on the upside. Offsetting that, retirees, especially younger, more mobile retirees, tend to have more time to comparison shop, potentially providing another governor on prices. And suddenly new retirees may find money more valuable than time. While I am certainly not claiming any direct relationship, inflation peaked in 2008, about the same time the first baby boomer retired and has been surprisingly tame ever since. I also think the shale boom and conversion of many energy-related systems as well as greater energy efficiency (think LED bulbs, increasing auto fuel efficiency) may pressure energy prices downward for some time. Fiscal spending on the state and local levels of government also remains under extremely tight control.
Not meaning to sound too much like a real economist, but there are real potential inflation boosters. At the moment, my bigger long-term worry is that government data on output potential suggests that more inflation might be at hand. The Congressional Budget Office suggested that the economy's full employment, full capacity output level was about $17.1 trillion for the second quarter and the actual output was about 17.0 trillion, or very close to full production. That gap is closing quickly, and should close completely by year-end, if our current growth forecast is correct. When actual production punches through potential output, a bout of meaningful inflation often ensues. Balancing everything out, over the next five to 10 years, we believe that inflation will likely end up in the 2.0%-2.5% range.
©2017晨星有限公司。版權所有。晨星提供的資料:(1)為晨星及(或)其內容供應商的獨有資產;(2)未經許可不得複製或轉載;(3)純屬研究性質而非任何投資建議;及(4)晨星未就所載資料的完整性、準確性及即時性作出任何保證。晨星及其內容供應商對於因使用相關資料而作出的交易決定均不承擔任何責任。過往績效紀錄不能保證未來投資結果。本報告僅供參考之用,並不涉及協助推廣銷售任何投資產品。


:quality(80)/cloudfront-us-east-1.images.arcpublishing.com/morningstar/5FNGF7SFGFDQVFDUMZJPITL2LM.png)
:quality(80)/cloudfront-us-east-1.images.arcpublishing.com/morningstar/EOGIPTUNFNBS3HYL7IIABFUB5Q.png)