A market commentator wrote on Jan 18, 2017, that "A stock that has no growth prospects and relies solely on future income expectations in determining its value closely resembles a bond or other fixed-income investment. Therefore, such stocks typically trade in line with the bond market. Rising rates hurt the price of bonds, and so stocks in low-growth industries also often fall in rising-rate environments."
We selected this quote not to single out the author, but because there seems to be an undercurrent of worry these days based on this kind of conventional wisdom about the risk to dividend payers in a rising-rate environment. (Articulating it may have even been the author's intent.)
High-dividend stocks do resemble bonds in some respects, and investors may indeed expect them to serve as bond substitutes in some portfolios, by the logic that when rates go up, they will lag or lose out to the broad equity market, because that's what bonds typically do when rates rise. Is that really true, though? We find the evidence to support it rather weak.
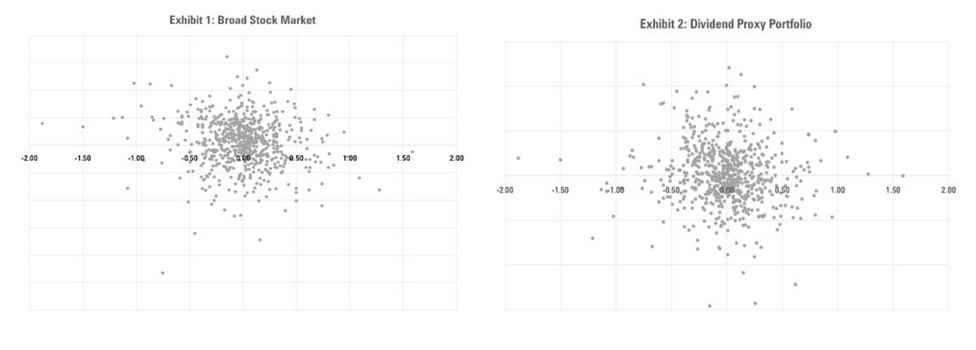
We've put together a couple of charts to help illustrate the point. One shows how monthly returns of the broad stock market (vertical axis) have reacted historically to monthly changes in the 10-year Treasury yield (horizontal axis). The other chart is similar, but instead of comparing the broad stock market's overall returns to 10-year Treasury yield changes, it illustrates how returns from an equity portfolio with long exposure to high-dividend stocks and short sales on low-dividend stocks would have been affected by the 10-year Treasury's yield shifts.[1] We're using that construction to adjust for the return impact on dividend payers inherent in their being part of the market as a whole, and we think of that long/short portfolio as our "dividend proxy portfolio."

As you can see, the charts look very similar. Exhibit 1 shows the broad stock market on its vertical axis, and Exhibit 2 uses our dividend proxy portfolio. If there is a relationship here, it's not obviously visible to the naked eye.
The most obvious qualitative conclusion from these basic charts is that changes in 10-year Treasury yields explain very little of the variability in either the broad stock market or dividend proxy portfolio returns.
That's not to say the effect doesn't exist. In fact, Morningstar's own Alex Bryan recently published a piece documenting that there is a statistical relationship between rates and dividend-stock returns.
And we can get a statistical estimate of that impact from Treasury yields by looking at regression coefficients. For the broad stock market versus the 10-year Treasury, the coefficient is negative 1.6. That means that, all other things being equal, a 1-percentage-point change in interest rates up or down should, on average, translate into a 1.6% drop, or rise, in the broad stock market, respectively. And if you look at high-dividend stocks and low-dividend stocks separately, you get about one year for the former and roughly negative 0.5 year for the latter. In effect, you might think of those statistics as observed, empirical duration estimates for how stocks have reacted to 10-year Treasuries.
But all things are not equal, and statistical significance doesn't necessarily translate into actionable investment decisions.
In this case, for example, the R-squared data for these comparisons are tiny, suggesting that--as is intuitive from the charts--movements in the stock portfolios can't be linked causally to movements in the 10-year Treasury. As such, you shouldn't have much expectation, for example, that you would observe a 1% shift in high-dividend stocks every time Treasury yields were to move 100 basis points.
One reason is that that nothing in capital markets happens in a vacuum. Although we have statistical tools to measure the impact and influence of various markets on each other, most intermarket relationships aren't exclusive. In other words, if we're looking at the interplay between two markets, it's just as likely that either one or both might be affected by movements in at least one other market, if not many markets.
For example, even though we used the dividend proxy portfolio to sift out the impact of the broad market's own movements, we can't really isolate the impact of Treasury yield shifts on the dividend proxy portfolio with perfection. The fact is that that there are numerous factors in play any time markets are moving, and Treasury yields are but one.
What does that all mean for the overall premise about interest rates and high-dividend stocks?
As the empirical durations and beta calculations suggest, it is statistically true that high-dividend stocks have a lower sensitivity to the overall equity market than do low-dividend stocks (0.73 versus 1.10, respectively). But, to the degree that it's even readily observable, the overall equity market is itself negatively correlated with interest rates.
When you tie it all together, it's hard to make a clear-cut case for avoiding high-dividend stocks. If you knew for sure in advance that rates were going up, and that the equity market was going up, and that the historical relationships would continue in the future, you might be justified in getting out of high-dividend stocks--and then only to capture a modest advantage.
To the degree that empirical duration is comparable to bond duration, a difference of 1.6 years between high- and low-dividend stocks is not all that big. (Interested readers can find by Maciej Kowara's discussion of bond funds reported versus empirical duration here.) We routinely see bond funds in the most popular intermediate-term bond Morningstar Category that differ in duration by at least that much. Another way to look at it is that, even if you actually could know the markets were going to behave as suggested, there are still probably much better ways to protect and profit with a portfolio.
That notwithstanding, the fact is that rates may go up from here--but they may not. Really. Conventional wisdom said that runaway rising rates were imminent before the 2008 financial crisis was even over--they were imminent for a good eight years. There were bond fund managers in 2009 and 2010 predicting that 10-year Treasury rates would be north of 8% before long. Meanwhile, an entire category of nontraditional bond funds exploded in size under the marketing of protection from rising rates; even with yields having backed up again sharply since mid-2016, their returns since the financial crisis still lag those of core bond funds with significantly less credit risk.
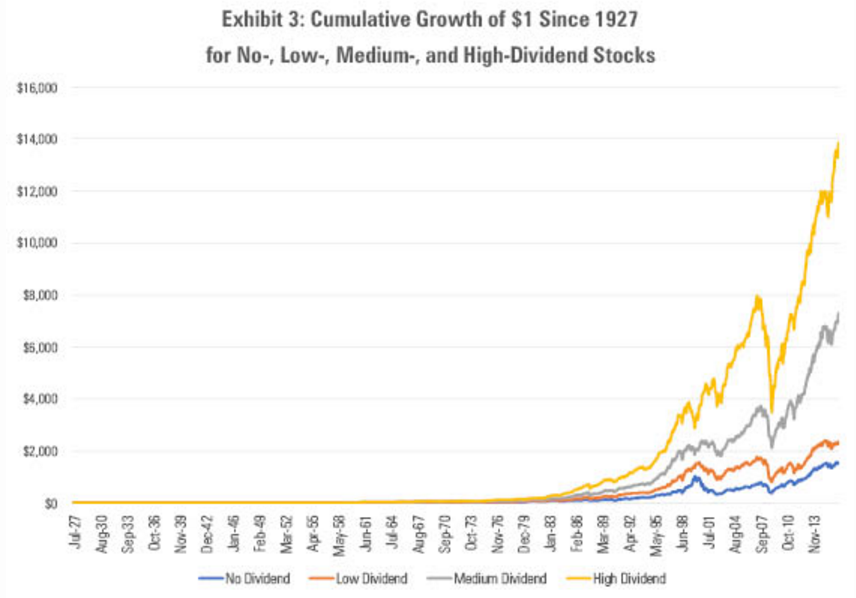
Given all that uncertainty, it is much more important to remember that high-dividend stocks have outperformed over the long term, even if having high dividends is one of the less reliable short-term factors. A long-term investor would be better off keeping this chart in mind rather than trying to outguess how stocks are going to react to bonds.

*[1]We used the St. Louis Federal Reserve Bank FRED site, which stores a 10-Year Treasury Constant Maturity Rate series going back to 1962. The dividend proxy is defined as a portfolio that goes long high-dividend stocks and short low-dividend stocks. Because of this construction (long-short) this portfolio will have largely (though not entirely) eliminated the effect of the market a whole. The data come from Kenneth French's data library, which maintains the original Fama-French factors plus all sorts of other interesting stuff.


:quality(80)/cloudfront-us-east-1.images.arcpublishing.com/morningstar/5FNGF7SFGFDQVFDUMZJPITL2LM.png)
:quality(80)/cloudfront-us-east-1.images.arcpublishing.com/morningstar/EOGIPTUNFNBS3HYL7IIABFUB5Q.png)


