Economic data did little to dispel the uncertainty, as most of this week's data was inconclusive, despite a lot of releases. With the GDP report due next week, the consensus estimate GDP forecast of 2.8% is uncomfortably high. We believe the actual result will likely split the difference at 2.4%. The more important year-over-year third-quarter GDP growth rate is likely to hover very near the 1.3% growth rate of the second quarter--near recovery lows.
Offsetting this glum GDP analysis, earnings news was generally better than expected during a week with a lot of reports. The new blended average forecast for S&P 500 earnings calls for a decline of just 0.3%, better than the 1.8% decline being estimated just last week. With just a few more upside earnings surprises, final third-quarter earnings could end up being positive for the first time in six quarters. However, the energy sector is weighing down those figures. Without energy, only the second quarter of 2016 showed a decline, and growth of 3.4% is being anticipated for the third quarter. So as queasy as I feel about the economy, earnings seem to be looking up a bit, and merger and acquisition news heated up, too.
Still, a softening economy will eventually influence earnings and stock prices. Poor economic news might also keep interest rates lower for longer, which could at least temporarily excite markets. So despite a slowing economy, markets still might hold together--though that is not a chance I am willing to take.
One by One, the Pillars of the Current Recovery Are Beginning to Fade
Much of today's economic analysis focuses on macro factors, especially interest rates. However, a lot of the growth has come from a collection of smaller groups doing well. This initially included autos, airliners, and the shale-related energy boom. Those factors peaked some time ago, and healthcare and restaurant meals accelerated to take their place. Now with the Affordable Care Act mostly in place, and employment growth slowing, those sectors are fading, too.
Even we were a bit surprised to see many categories peaked out. At the moment we can't identify many sectors that would be able to fill the void. We also note that the housing news, viewed from a longer perspective, seems to be slowing, too, as we discuss below.
Inflation: More of the Same, With Danger Lying Around the Corner
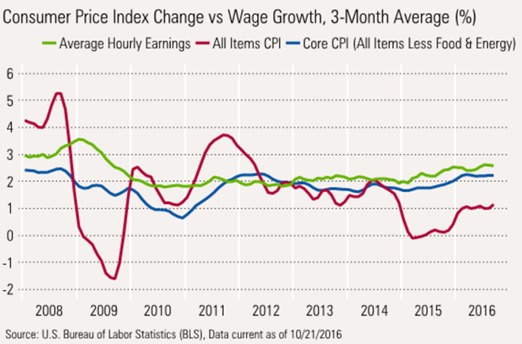
Headline or all-in inflation remained stuck in the 1.0%-1.1% annual range as it has every month since February. Note, however, that food inflation is lower, energy deflation is much lower, and the huge services category (about 60% of the index) continues to power ahead. With energy prices stabilizing, we suspect it's unlikely that energy deflation will help the CPI calculation, and by the middle of next year headline inflation will approach the core inflation rate of 2.2%. Even that core number has the potential to move higher. Historically, wage growth has moved in line with core inflation. However, as core and headline inflation approach each other, that puts a real hole in consumer spending for 2017.
Poor Industrial Production Performance Driven by Computer-Related Products
Some economists were excited that manufacturing industrial production in September increased after a recent decline. We were less than thrilled because the long-term chart still looks terrible. That's not great for a sector that accounts for 12% or so of GDP.
We lined up the four worst-preforming industrial sectors since 1990 and were truly astounded by the results. As expected, printing, apparel, and textiles all showed sizable declines. However, even putting these three laggards together doesn't add up to what was lost in computer hardware and semiconductors.
Housing Data Another Mixed Bag; Safe to Say It Won't Be an Economic Savior
Like the industrial production data, many investors took solace in the fact that existing-home sales were moving up again. However, before one gets too excited, the year-over-year data is stuck in a terrible downdraft with no year-over-year growth in existing-home sales. Poor inventories suggest the problem may persist. Both starts and permits continued in a downward trend. Single-family homes are faring better, but the results still show a clear pattern of slowing growth. That is better than the outright declines being experienced by the multifamily sector, though. Meanwhile, builder sentiment is down, but not nearly as bleak as starts and permits.
©2016晨星有限公司。版權所有。晨星提供的資料:(1)為晨星及(或)其內容供應商的獨有資產;(2)未經許可不得複製或轉載;(3)純屬研究性質而非任何投資建議;及(4)晨星未就所載資料的完整性、準確性及即時性作出任何保證。晨星及其內容供應商對於因使用相關資料而作出的交易決定均不承擔任何責任。過往績效紀錄不能保證未來投資結果。本報告僅供參考之用,並不涉及協助推廣銷售任何投資產品。


:quality(80)/cloudfront-us-east-1.images.arcpublishing.com/morningstar/5FNGF7SFGFDQVFDUMZJPITL2LM.png)
:quality(80)/cloudfront-us-east-1.images.arcpublishing.com/morningstar/EOGIPTUNFNBS3HYL7IIABFUB5Q.png)